





Ada Tech x Puma
AI DRIVEN SOFTWARE FOR puma to make informed design decisions
Product Design | user research | artificial intelligence

De-Risking footwear and product
design through predictive AI
An AI-powered analytics platform built with PUMA as our client, turning design intuition into data-backed decisions.
Ada Tech, now Tadavo, is an NSF-funded startup that spun out of Northeastern University’s Center for Design and College of Engineering, built in partnership with PUMA for the summer to change the front-end of product development and sales strategy using machine learning and AI.
*Certain aspects of this project are under NDA. Reach out to learn more.
Problem
PUMA’s design teams struggled to predict market trends, causing lengthy decision cycles and missed opportunities.
Solution
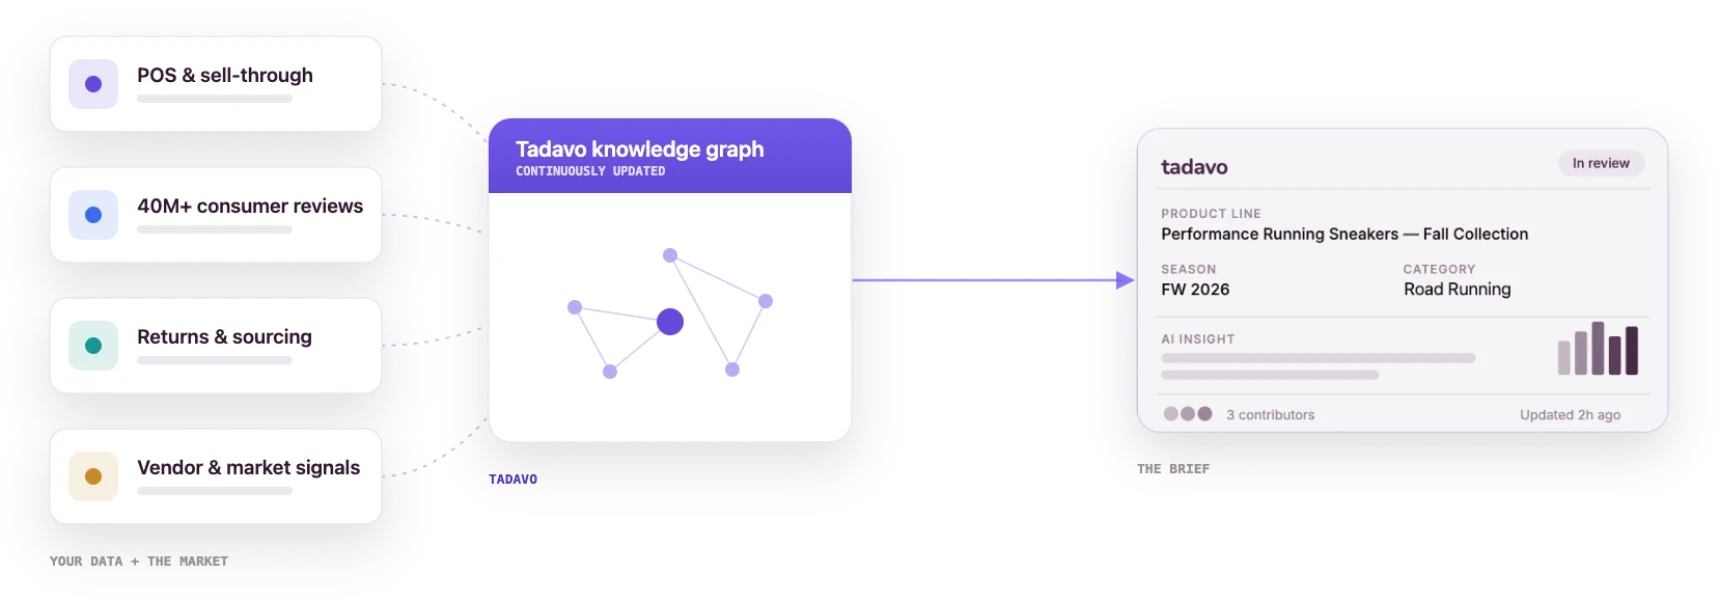
We built Ada, an AI platform that turns market data, consumer feedback, & design trends into actionable insights.
Results
Predicting to accelerate design decisions by 40%, and successful launches by 25%, and improved cross-team collaboration.

My Role at Ada Tech
PRODUCT
AI-powered performance analytics platform for footwear design decisions
TIMELINE
May 2022 - April 2023 (Now a startup named Tadavo)
MY ROLE
I joined Ada Tech (now Tadavo) as a UX Design Intern and grew into a User Experience Designer.
Working alongside Northeastern’s Center for Design to rework the product based on real user feedback, driving a 20% lift in usability and helping ship the ALPHA prototype through hands-on testing with cross-functional teams.
What made this role different from a typical internship was the stakes.
We were designing with real PUMA stakeholders in the room ,their Boston-based design and sales teams were our users, our critics, and eventually our validators.
Led end-to-end design of PUMA’s sales management platform, improving team efficiency and hitting a 95% user satisfaction rate through research-driven, iterative design.
Designed and prototyped 30+ high-fidelity, responsive screens across dark and light modes, refining usability and visual coherence through continuous user feedback.
Transformed raw sales data into a visually structured analytics dashboard, building a WordPress GUI that simplified performance tracking and surfaced key success metrics.
Ran user testing sessions to keep the ALPHA prototype on schedule, partnering with cross-functional teams to embed user-centered design principles.
OUR APPROACH
Our core innovation wasn’t replacing creative intuition—it was arming designers and commercial teams with the market data needed to de-risk decisions long before production.
IMPACT
This AI-powered tool is anticipated to increase Puma’s design and market analysis efficiency by up to 30%, fostering a 20% rise in innovation and efficiency. Enhance success & strengthens Puma's market position in the footwear industry.

👨💻🎓 The team consisted of designers, engineers, and PhD students from Northeastern & University of Michigan.
THE 30 SECOND VERSION
The problem with gut-instinct design decisions
Designers were creating 15–20 design concepts per cycle.
Without a way to evaluate performance before launch, design decisions defaulted to gut instinct. The cost wasn’t just bad products — it was a slower, less confident team.

The "Why Now" - Industry Context
The footwear industry operates on a high-risk, long-lead-time model. Designing a shoe from initial CAD render to factory floor takes anywhere from 12 to 18 months.
During this window, product teams must make multi-million-dollar decisions on materials, colorways, and factory tooling—often relying on intuition, past trends, or delayed market signals.
When a design fails to resonate with consumers:
Irreversible Tooling Costs:
Steel and aluminum outsole molds cost upwards of $50,000 per model for a full size run before a single pair is sold.
Severe Profit Erosion
Unpopular models force heavy discounting, with brands routinely marking down 40% to 50% of underperforming lines to clear dead stock.
Environmental Waste:
Globally, over-manufacturing leads to billions of dollars in unsold inventory and tons of material waste.
SOLUTION
The Problem We Are Solving
Predicting consumer demand for brand-new, unreleased footwear is fundamentally a "cold start" problem. Traditional demand forecasting relies heavily on historical sales data—which doesn't exist for novel silhouettes, innovative materials, or experimental aesthetics.

Concept Evaluation
Design CAD renders, color palettes, and material specs exist in visual formats that traditional sales forecasting models cannot interpret.

Eliminating Gut-Feel Bias:
Product lines are often greenlit based on subjective internal feedback rather than quantifiable consumer signals.

Evaluating Pre-Production Viability:
Automatically extracts visual, technical, and market trend features from pre-production concepts to evaluate performance before factory production.
CHALLANGES I FACED AS A DESIGNER
Joining Mid-Stream
I joined Ada Tech after the backend ML models and technical foundations were already built.
With a compressed timeline and limited runway for deep primary research, my challenge was joining a moving train rapidly synthesizing existing technical documentation and stakeholder notes to pinpoint the core UX problem statement.


Synthesized Insights:
Absorbed months of prior technical research to sharpen the core UX problem statement.
Decoded AI Data:
Turned raw model outputs into visual patterns like radar charts and source tooltips.
Designed the Product:
Built the UI flows and component system that turned academic AI into an enterprise platform.
WHAT THE DATA SHOWED US
We Analyzed the Demand Variance Gap
Investigating our footwear launch risks revealed a clear pattern across supply and sales data:
The biggest financial losses didn't happen on the factory floor, but from a lack of market signals during early design exploration.
50%–100% Forecast Error: Lacking sales history, new silhouettes relied on gut feel leading to misallocated production budgets.

Root cause mapping: Traces how pre-production forecast errors lead directly to overproduction and warehouse deadstock.

LEARNING FROM DATA & USERS
Puma's Design Process
In 2022, PUMA’s design process relied on slow, analog sampling. Physical prototypes bounced between design centers and factories for up to five rounds of changes wasting weeks and budget, all without any structured customer demand signal.
the feedback loop and time & money.
The gap between a design decision and real-world market feedback was months long.
By the time sales data or reviews trickled in, the next product line was already locked leaving zero opportunity for early course-correction.

To understand the wholesale pitch experience, I conducted contextual inquiries across live PUMA sales meetings and buyer presentations.
Shadow Research & Workflow Observations
1
How they pitch unreleased concepts
Their reliance on static pitch decks, physical swatches, and verbal feature explanations.
2
How buyers challenge metrics
Questioning forecast numbers, competitor benchmarks, and target demographic fit.
3
Data provenance is requested
Asking for the origin, recency, and sample size behind sentiment scores.
4
How decision trade-offs are made
Balancing wholesale volume orders against line-item risk across footwear categories.
Sales reps struggled to prove market demand for new silhouettes without hard data, relying heavily on personal enthusiasm.
Buyers hesitated on bold or novel designs without proof of consumer sentiment, delaying order commitments.
Reps couldn't answer source questions on the spot, creating friction and forcing follow-up emails instead of closing in-meeting.
Lack of instant data access led buyers to default to safe, legacy silhouettes rather than taking chances on new designs.
We spoke to 10 people, both design and sales teams from PUMA to understand how the shoe production process works, in the current day and why is it special?
01: Footwear Product Designer
Primary research
02: Product Line Manager
Secondary research
Footwear Product Designer
Product Line Manager
Footwear Product Designer
John Strak
"Design is about predicting the needs of the future!"
Needs
Special shoe design that would fit in the future
The shoe that performs well and looks good will own the market
Build a product that lasts long, catering to the user at the highest level
Frustrations
Unable to compare market trends and get feedback on shoe design
No clear insights from the customers and the market
Wants to feel confident about his design before market launch
Key Insights & Opportunity Areas
Feedback Vacuum
John creates 15-20 design concepts before narrowing down, but receives structured feedback on only 20% of rejected designs.
Trend Analysis Paralysis
Spends 12+ hours weekly manually researching trends across different markets and competitors.

Difficulty in Trend Comparison
Designers struggle with analyzing and predicting market trends due to a lack of comparative tools.
4–5 Rounds
Of physical prototyping required per shoe silhouette
$50K+
Committed per size run in premature outsole tooling
80%
Of sample revisions driven by internal guesses rather than real demand
This is the problem Ada Tech set out to solve: not to replace the designer's intuition, but to give it data to work with.

“What if designers and sales teams could predict before a single sample is produced whether their design would actually sell in the market?“
OPPORTUNITY MAPPING & FEATURE STRATEGY
Turning Workflow Friction into Product Strategy
By mapping the bottlenecks in PUMA's existing workflow, we identified key opportunity areas where our AI technology provided the highest leverage—enabling us to strategically prioritize product features
Current State (As is)
Designers and product teams lack efficient tools to measure a product sucess leading to:
Delayed identification of quality issues
Subjective decision-making process
Limited customer feedback integration


V/S
Opportunity Areas (To be)
What if we could efficiently assess key factors like durability, comfort, and performance to:
Enable data-driven design decisions
Improve product quality standards
Accelerate feedback integration
DESIGN SOLUTION
Breaking down the problem into key components and solution buckets:
01: Concept Evaluation
Evalaute your designs by uploading pictures in the software
02: Customer Insights
Explore the vast shoe database, and filter down to get results
03: Inspire Me (Generative Designs)
AI generated deisgns based on prompts to help generate ideas
The IA phase was where I spent the most time early on.
Defined the high level of information flow for the ALPHA Prototype.
Three interconnected workflows, each with their own logic, data models, and conditional states but all living inside a single navigation structure. The risk was redundancy: building the same UI pattern three times, or worse, confusing users about which workflow they were in.
I mapped the shared components first, then designed each workflow to use them consistently.

Here is a detailed breakdown of the key screens, UI components, and end-to-end user flows I designed to power the Ada platform experience:
Home Screen
Common Functionality
Customer Insight
Concept Evaluation
Data Visualization
Dashboards
The Home screen anchors the initial entry point and main display, simplifying the platform’s navigation.
Designed the final layout products and visual dashboards to showcase the results from simulation runs to audiences and customers.
Designed the shared features which incorporated user profiles, authentication interfaces, support, info pages, etc.
Focused on the Client Discovery sections to construct diverse panels from the current footwear database and exhibit data in an organized format.
Develop diverse data illustrations and instructions on visualizing the data by generating bar graphs, graphical elements, and radar charts.
Worked on the workflow for concept to understand clear flow for analyzing a new shoe in the market.
TESTING EARLY CONCEPTS
Wireframing happened in rapid cycles
Lo-fi first, to validate structure with the team. Then mid-fi, to pressure-test the flows with PhD researchers and engineers. Then hi-fi, built in Figma with a component system we could update across three workflows simultaneously.
(Note: Visual assets are intentionally blurred to comply with non-disclosure agreements.)


ENTRY POINT
We rolled out the beta to a cohort of PUMA footwear designers and closely monitored early usage sessions.
Early beta sessions with PUMA footwear designers revealed a key point of confusion: users struggled to distinguish between analyzing past market sentiment and evaluating new concepts.
To resolve this, we redesigned the home hub around three distinct workflows:

Database Exploration: Historical footwear performance and consumer sentiment.
Concept Evaluation: Predictively score pre-production silhouettes before sample runs.
Generative Design: Explore fresh visual directions for early-stage ideation.
Structuring the workspace into these targeted entry paths eliminated navigation ambiguity, cut time-to-task, and built confidence in AI-driven insights.
CONCEPT EVALUTAION
Historical product benchmarking and attribute sentiment.
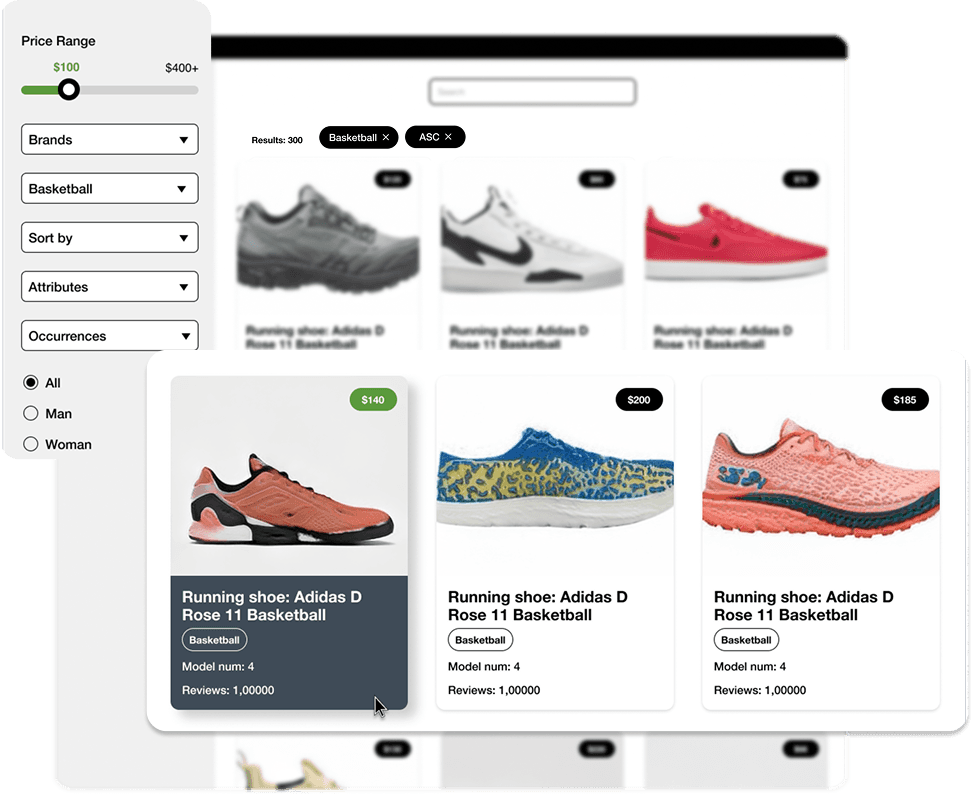
Designed a searchable footwear repository allowing teams to filter past styles by brand, price, category, and visual attributes.
Clicking into any product surfaces granular sentiment analysis—mapping consumer feedback across key design attributes using radar charts and attribute distributions to establish clear performance baselines for new concepts.
CONCEPT EVALUTAION
Deep Dive: The Customer Insight Dashboard
To help design and product teams make sense of complex market data, I architected a unified Customer Insight dashboard.
The page follows a macro-to-micro progressive disclosure model—moving users from high-level visual pattern recognition down to the raw voice of the customer and competitive positioning.

Module 1: Sentiment Analysis (Macro Attribute Performance)
The Design Challenge:
Footwear performance isn't single-dimensional; a shoe can excel in cushion but fail in upper durability or lateral stability. Standard numerical averages hide these critical trade-offs.
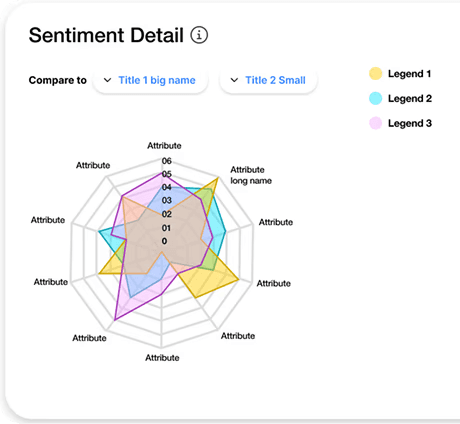
Radar Chart for Multi-Attribute Overlays:
Maps 5–8 footwear attributes into a single shape, allowing designers to overlay competitor profiles and spot performance gaps instantly without analyzing raw data tables.

Distribution Chart for Score Variance:
Reveals score variance—distinguishing neutral consensus from 50/50 user polarization—giving teams the statistical confidence needed before committing to expensive mold production.
Module 2: Need Finding & Option Summaries (Micro Customer Voice)
The Design Challenge:
Quantitative charts indicate where a product is struggling, but designer need qualitative context to understand why consumers feel that


2x2 Need Finding Matrix & Option Summaries:
Synthesizes raw review data across two critical axes :
Sentiment (Positive vs. Negative) and Intent (Implicit vs. Explicit Needs).
This allows designers to quickly identify unstated friction points alongside direct feature requests. Displays top-voted positive and negative review cards side-by-side, surfacing authentic user language and immediate visual proof to back up design iterations.
GENERATIVE DESIGN
Translating market data and visual prompts into viable footwear concepts.
Generative Design: Uses AI to rapidly turn trend data and visual prompts into new footwear silhouettes—accelerating early-stage ideation without bypassing designer intuition.

FEEDBACK LOOPS
Feedback from the Puma Team
I presented the final prototype to PUMA's Boston team in person. It was the highest-stakes moment of the project; real stakeholders, real workflows, and a product that was still being refined. The response was largely positive, with meaningful pushback in two areas:

Building Trust via Data Provenance
Sales leads needed transparency before presenting AI metrics to buyers.
We introduced metric-level tooltips showing source, recency, and sample size—instantly unlocking commercial confidence.
Eliminating Pre-Upload Drop-Off
First-time users weren't sure what Concept Evaluation would do with their images.
Adding a brief explainer step before the upload flow added one screen, but eliminated the biggest drop-off point.

Here’s me presenting the final design and prototypes to the PUMA team based in Boston.
KEY TAKEAWAYS
While I would love to give more details..
I have had the privilege of working with an amazing team. While I am bound by Non-Disclosure Agreements (NDA) that require confidentiality, I am excited to share some of the valuable skills, experiences, and outcomes I achieved during my tenure at Ada.
Every design constraint is an opportunity to grow.
Here’s how I created solutions that balanced user needs with business goals.
Designed for established platforms
Building a first-of-its-kind platform presented unique challenges—challenges we met by anchoring every design decision in rigorous user data.
Uncovering edge cases
Navigating a large-scale database presented unique design challenges; bridging wireframes with front-end and back-end integration allowed us to uncover and resolve critical edge cases early.
Finding balance between business goals and user needs
As product designers, we're taught to prioritize user needs, but it's equally important to consider how design decisions impact a business's growth and longevity.

WHATS NEXT
Ada Tech is now Tadavo⇗
Built to bridge AI performance prediction with human creativity, Tadavo continues our mission of transforming complex market intelligence into intuitive design workflows.